EmCog
Problem: Evaluating workplace well-being usually relies on subjective surveys. We needed to create a mobile app that could take raw, objective biometric data and turn it into clear insights about a worker's cognitive load and stress.
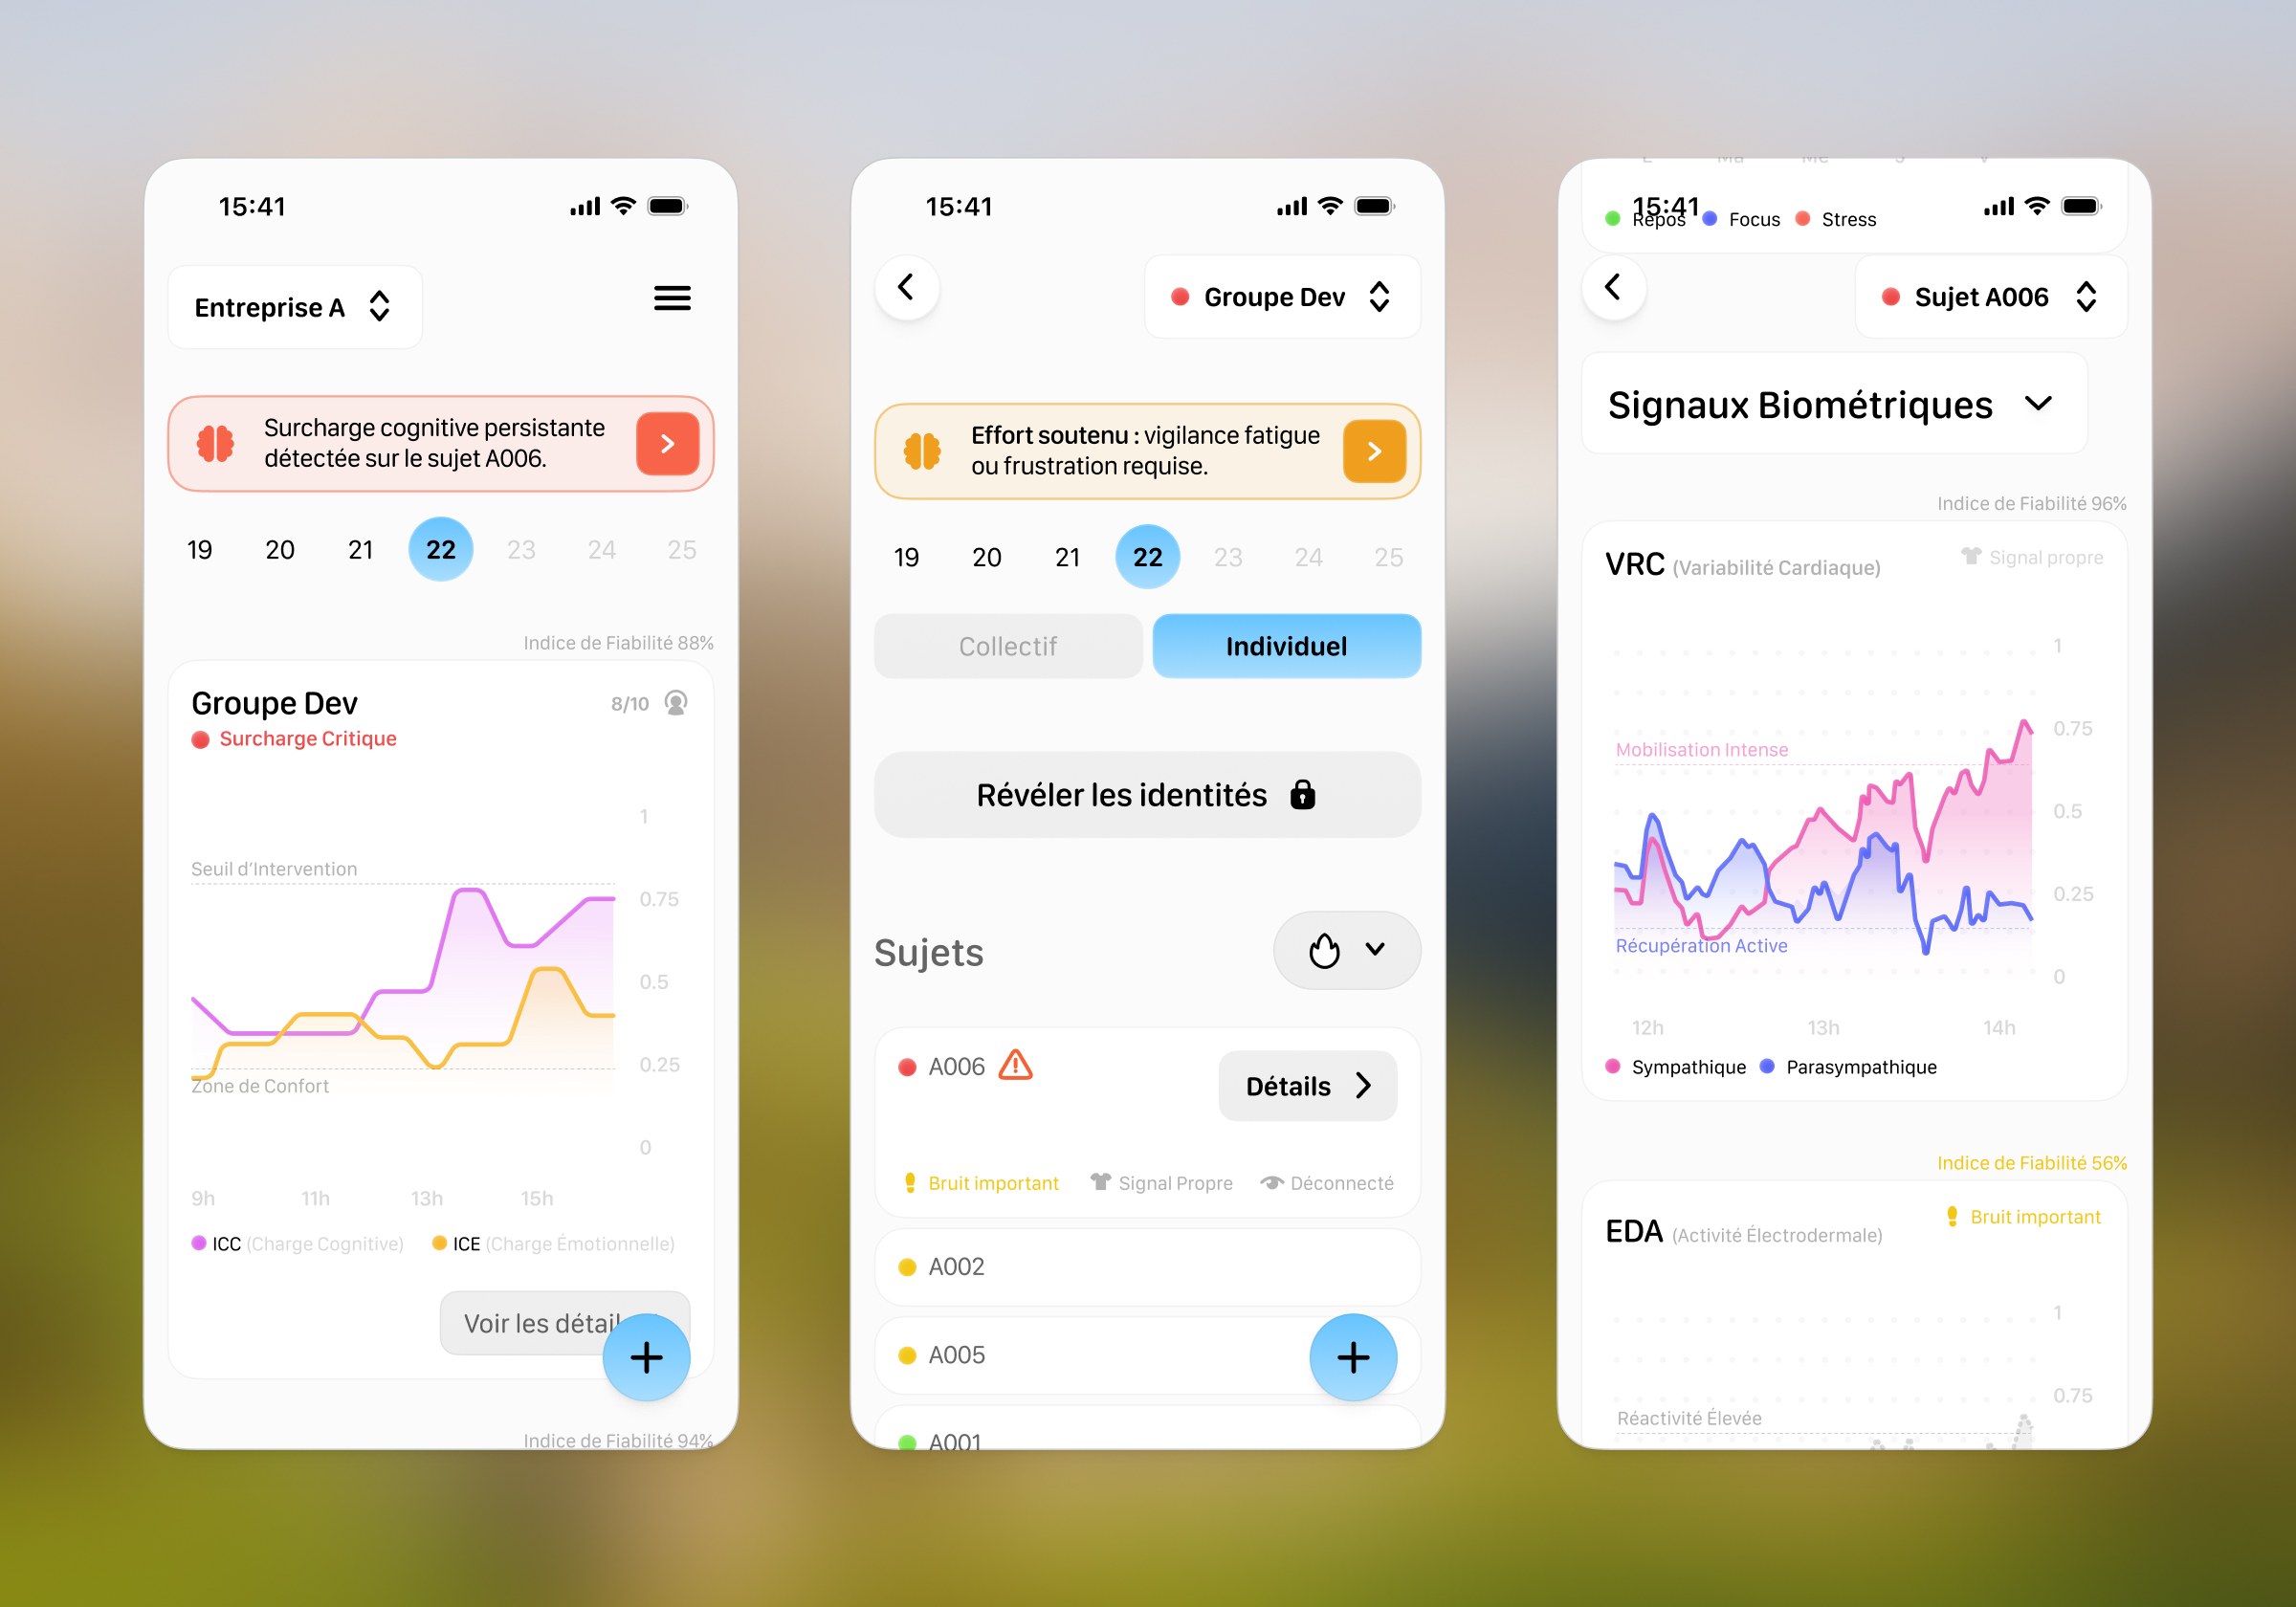
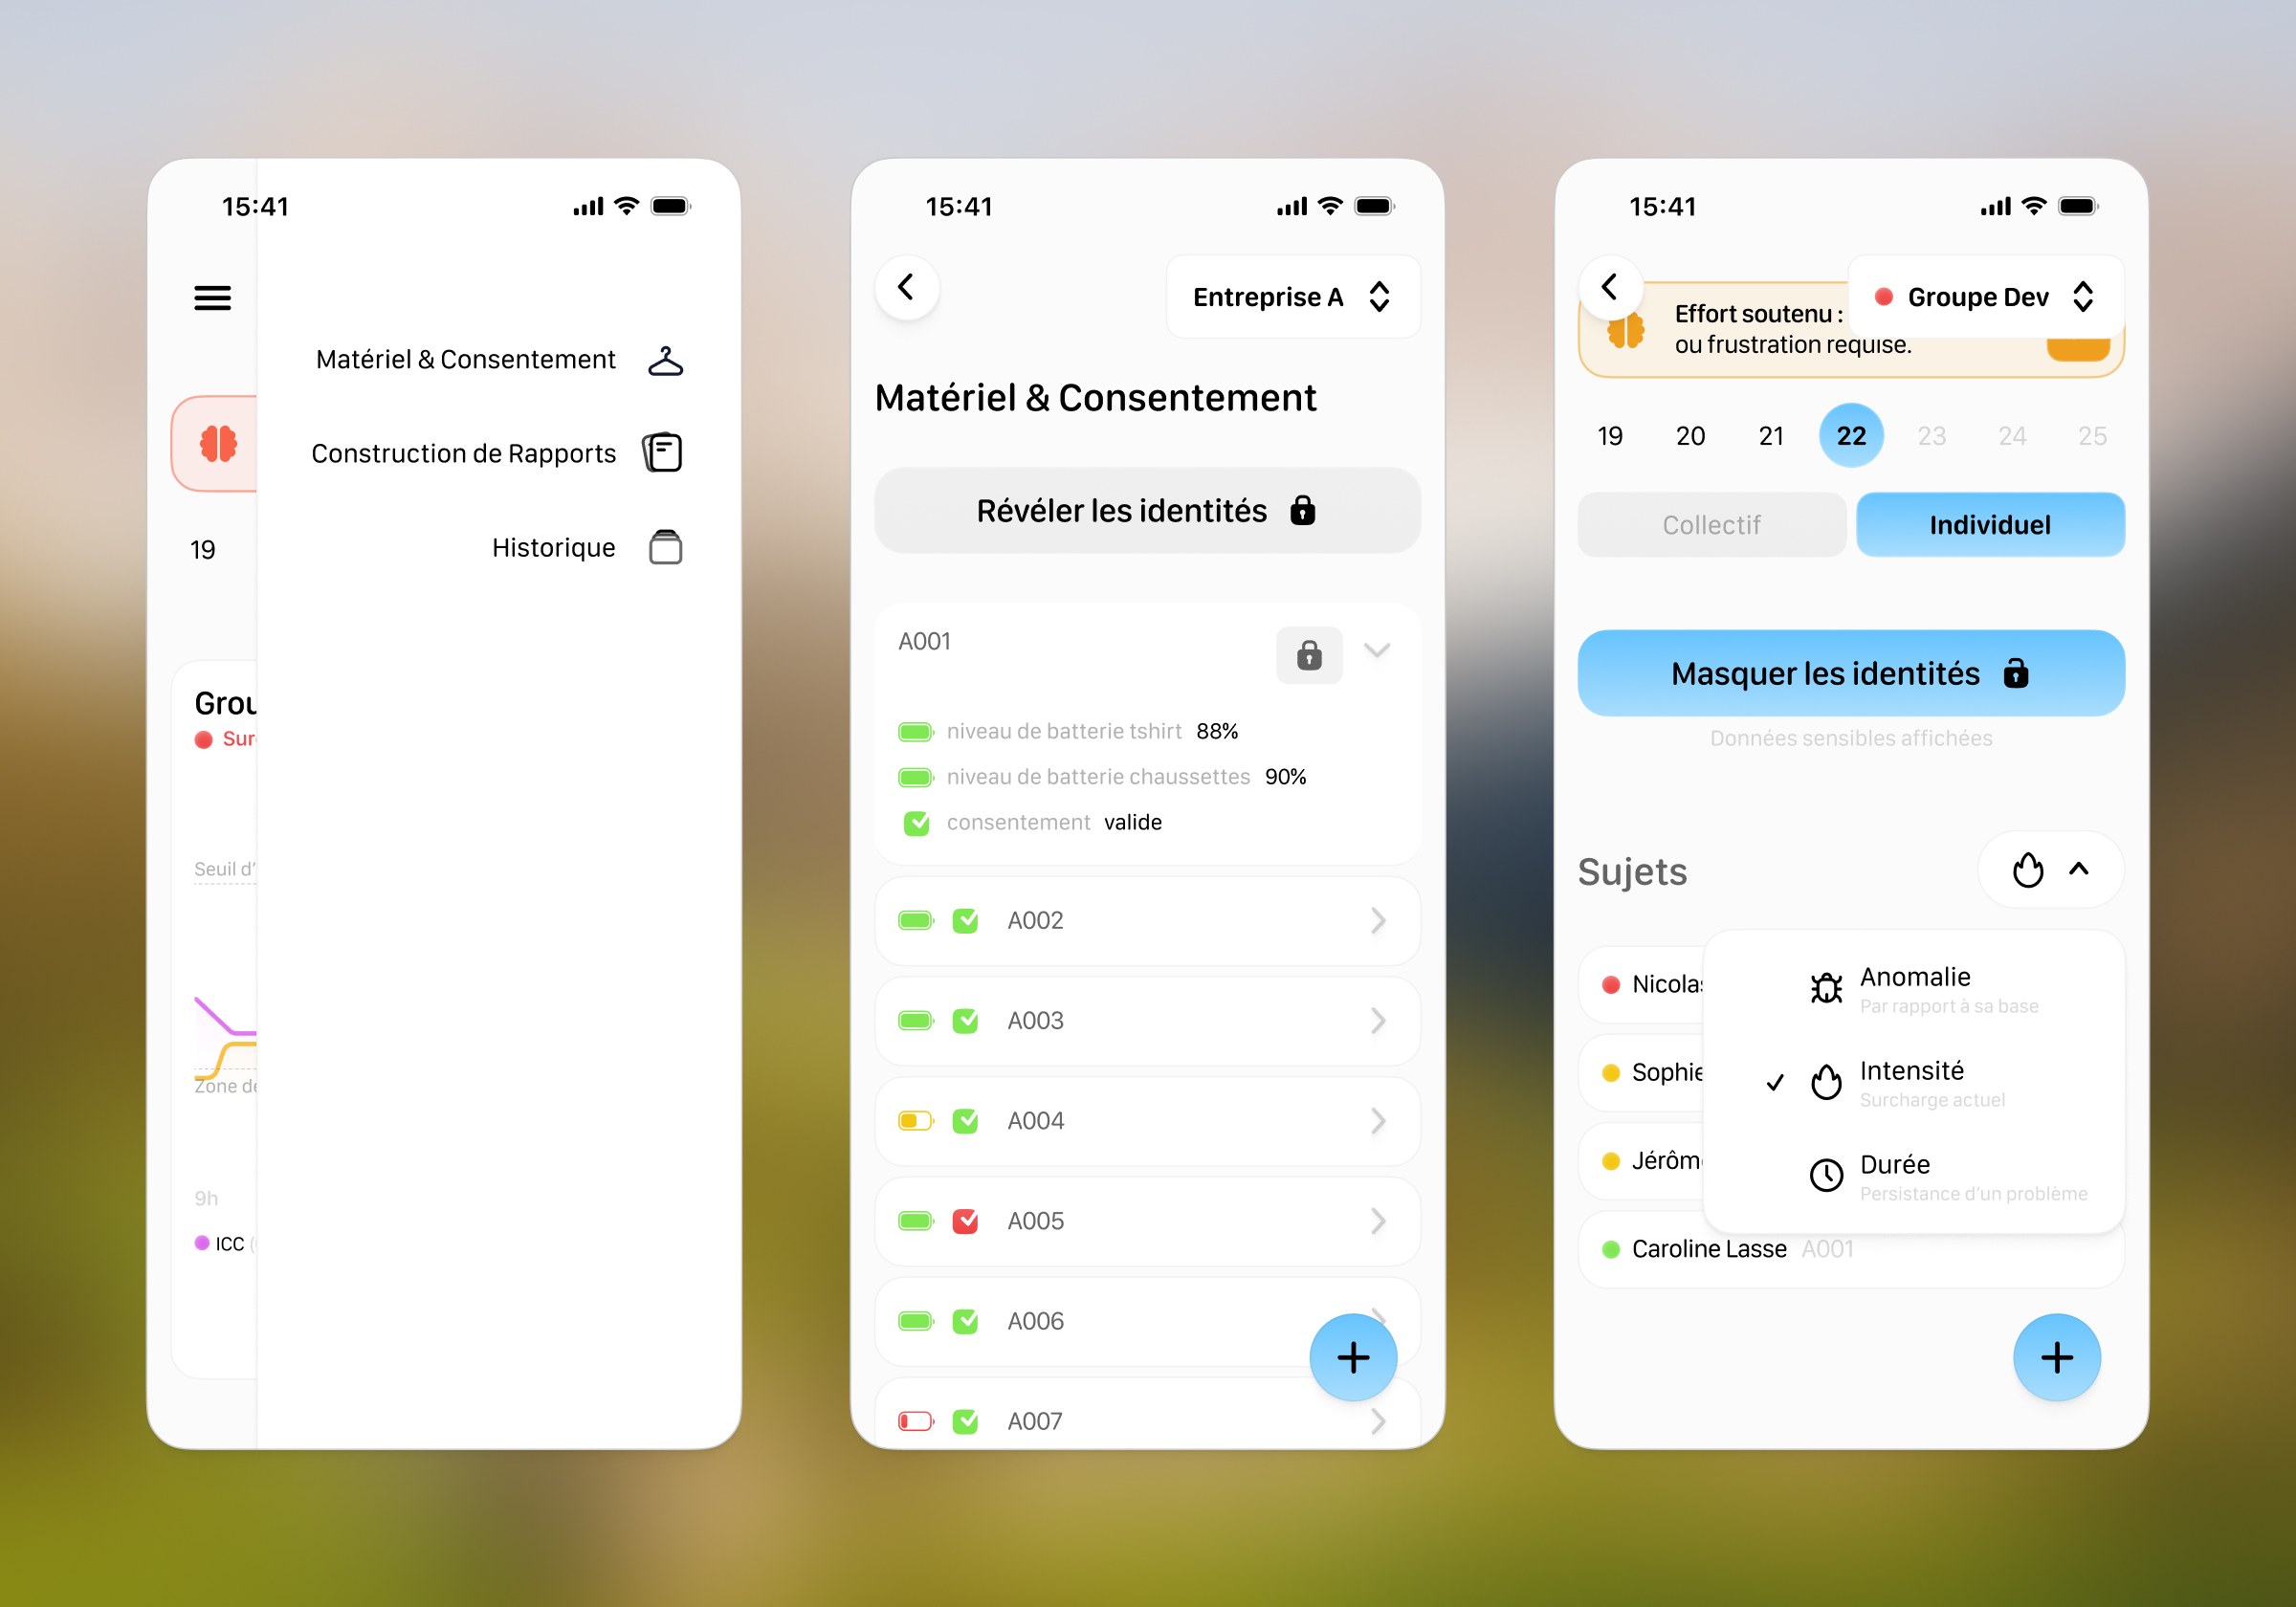
Outcome: During a five-day academic sprint, I designed a 20-screen prototype that visually separated sudden emotional stress from general cognitive fatigue. By swapping a confusing heatmap for a simple 2D grid with a timeline slider, we made the data much easier for ergonomists to read.
Context
Corporate ergonomists look at workplace well-being, but they usually have to rely on subjective, after-the-fact surveys.The EmCo project was about building an objective tool to turn raw biometric data into clear Quality of Work Life indicators.
The Challenge
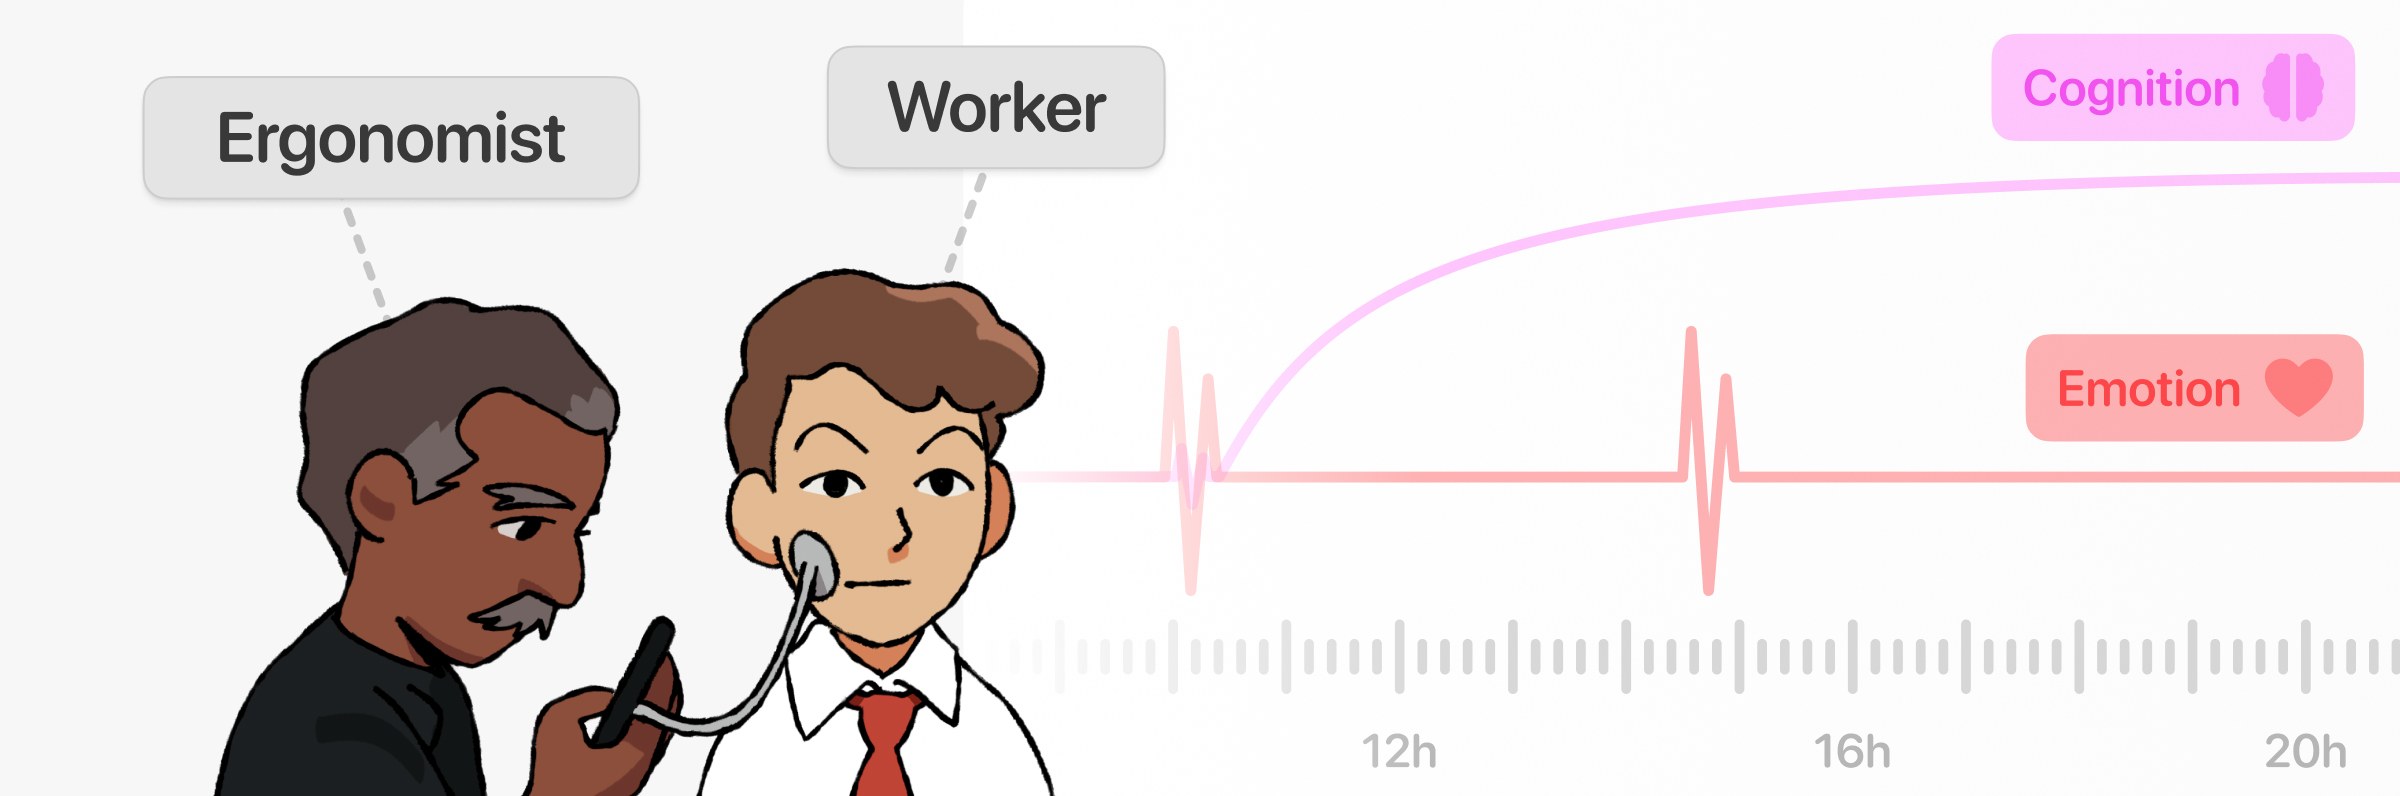
Emotion and mental workload cause similar physical reactions, but they happen on different temporal scales. Emotions are quick spikes, while cognitive load represents sustained resource mobilization. The main UX challenge was finding a way to show these two different realities visually without overwhelming the user with raw data.
Scope
Working with a team of six, my job was to figure out the information architecture and design the UI, putting together a 20-screen mobile prototype.
Making Sense of the Data
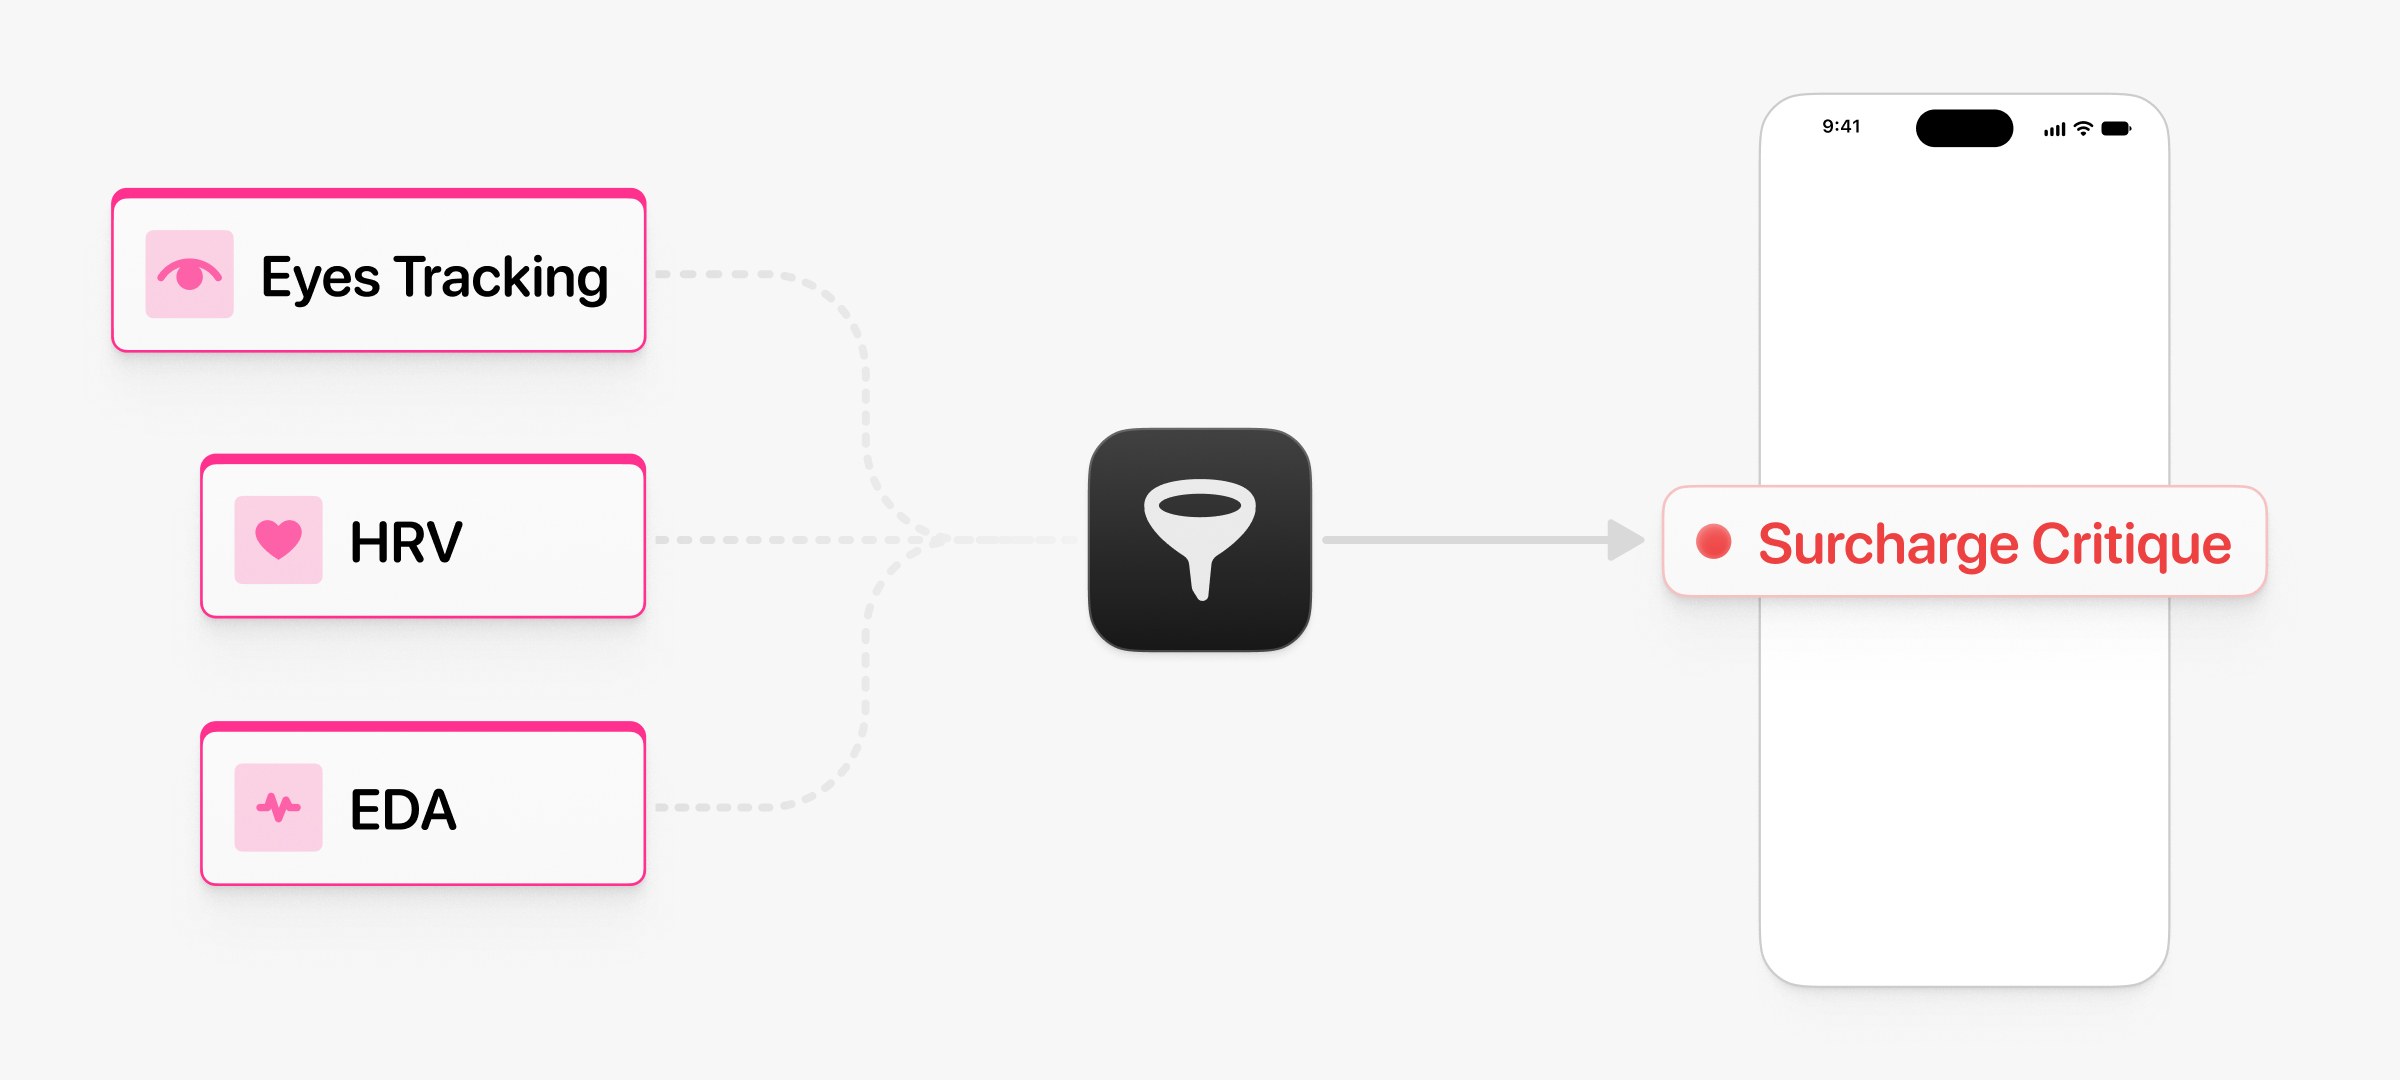
Raw data is hard to read on the fly. To keep things clear, I turned complex biometric streams into human-readable status labels like “Productive Focus” or “Critical Overload.”
Privacy
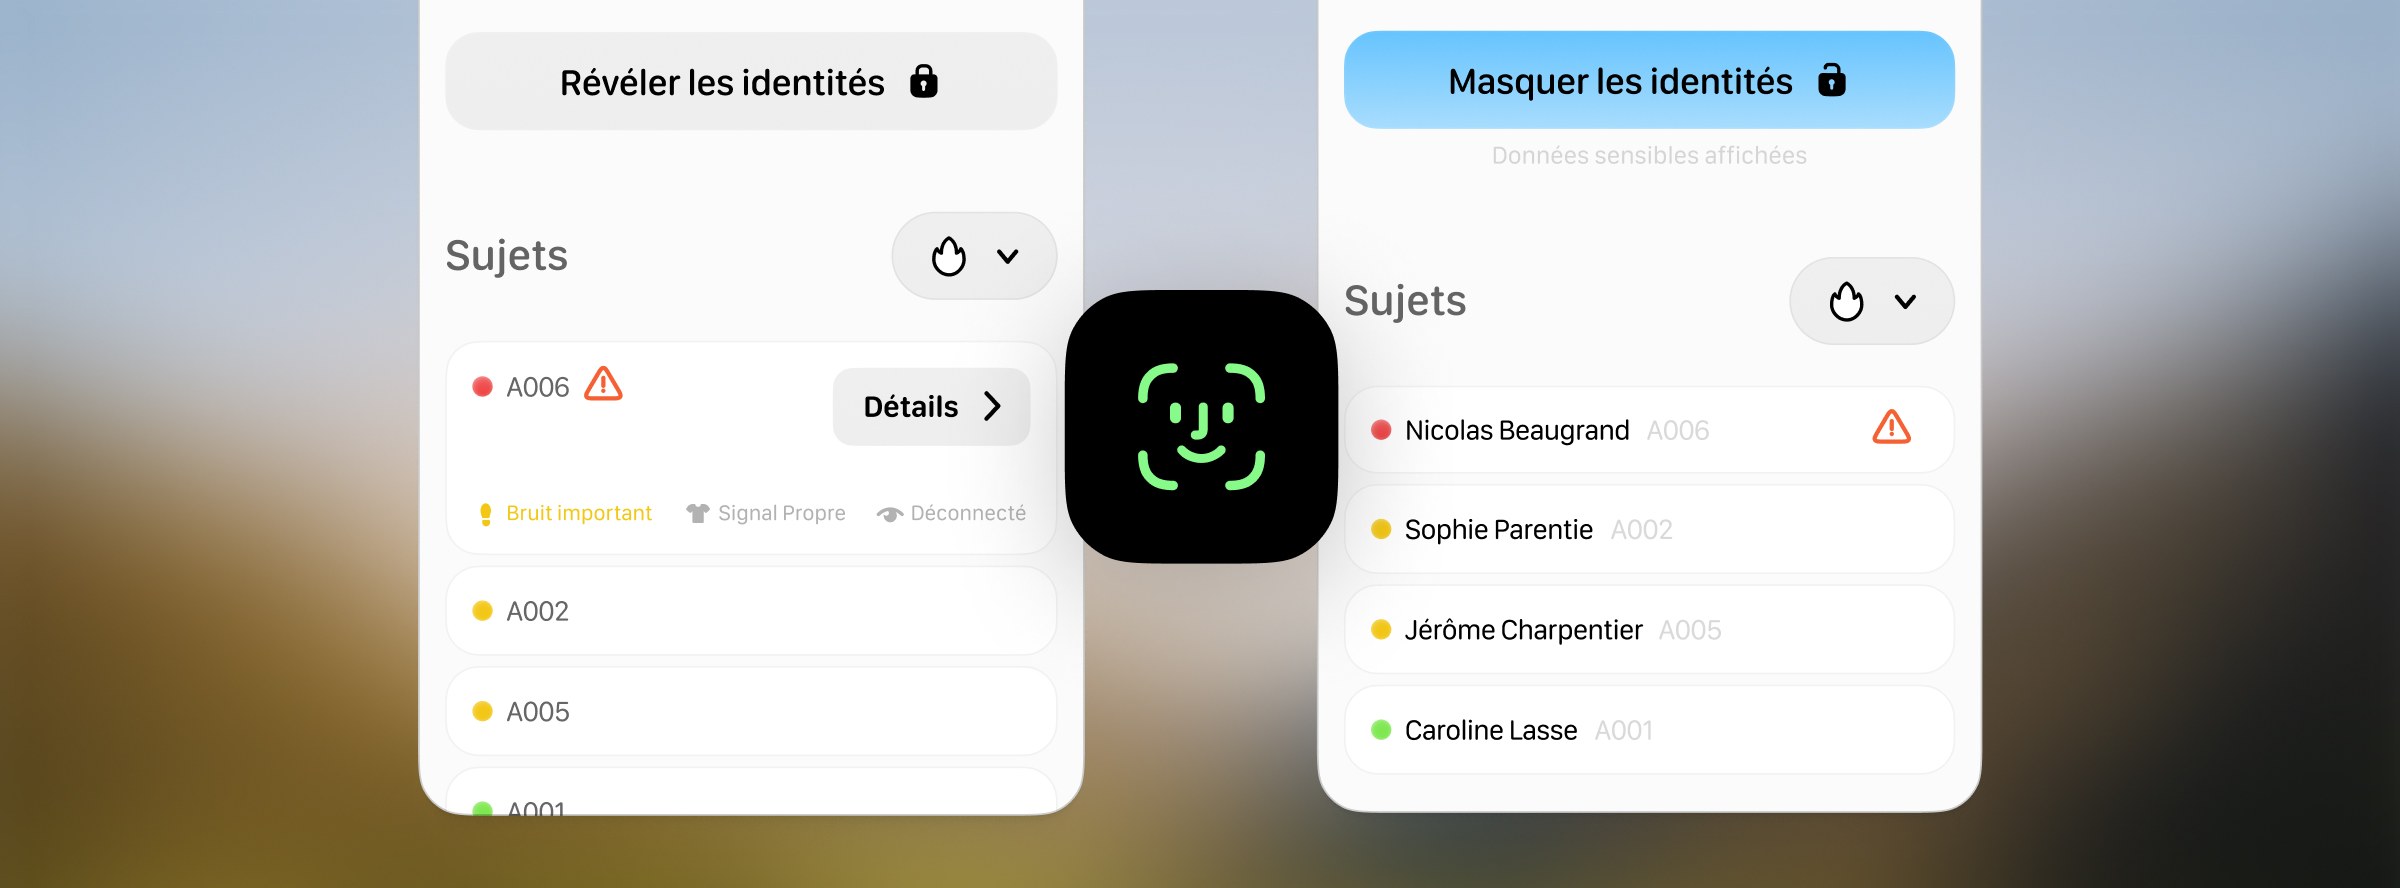
To handle patient privacy during live sessions, I added a FaceID-style unlock. This let ergonomists quickly check who they were monitoring without the long-term interaction friction of passwords.
Rapid Execution
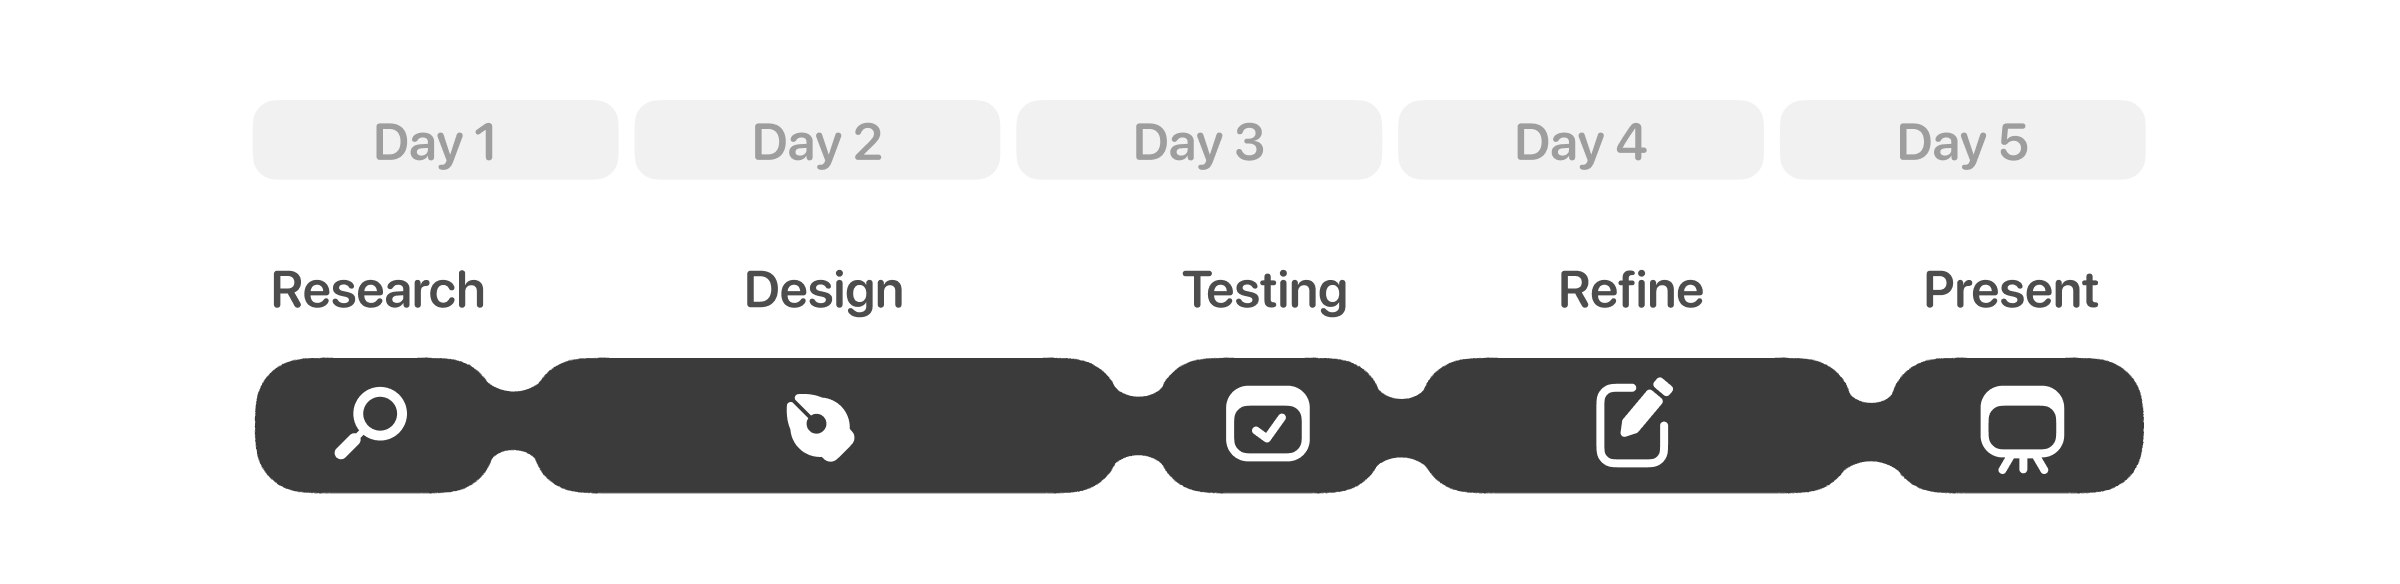
Because we only had five days from start to finish, I kept the UI design phase to just two days. To save time, I used AI tools to get quick feedback on my wireframes before we ran usability tests with five cognitive engineering professors and PhD researchers acting as proxy users on day three.
Usability Evaluation
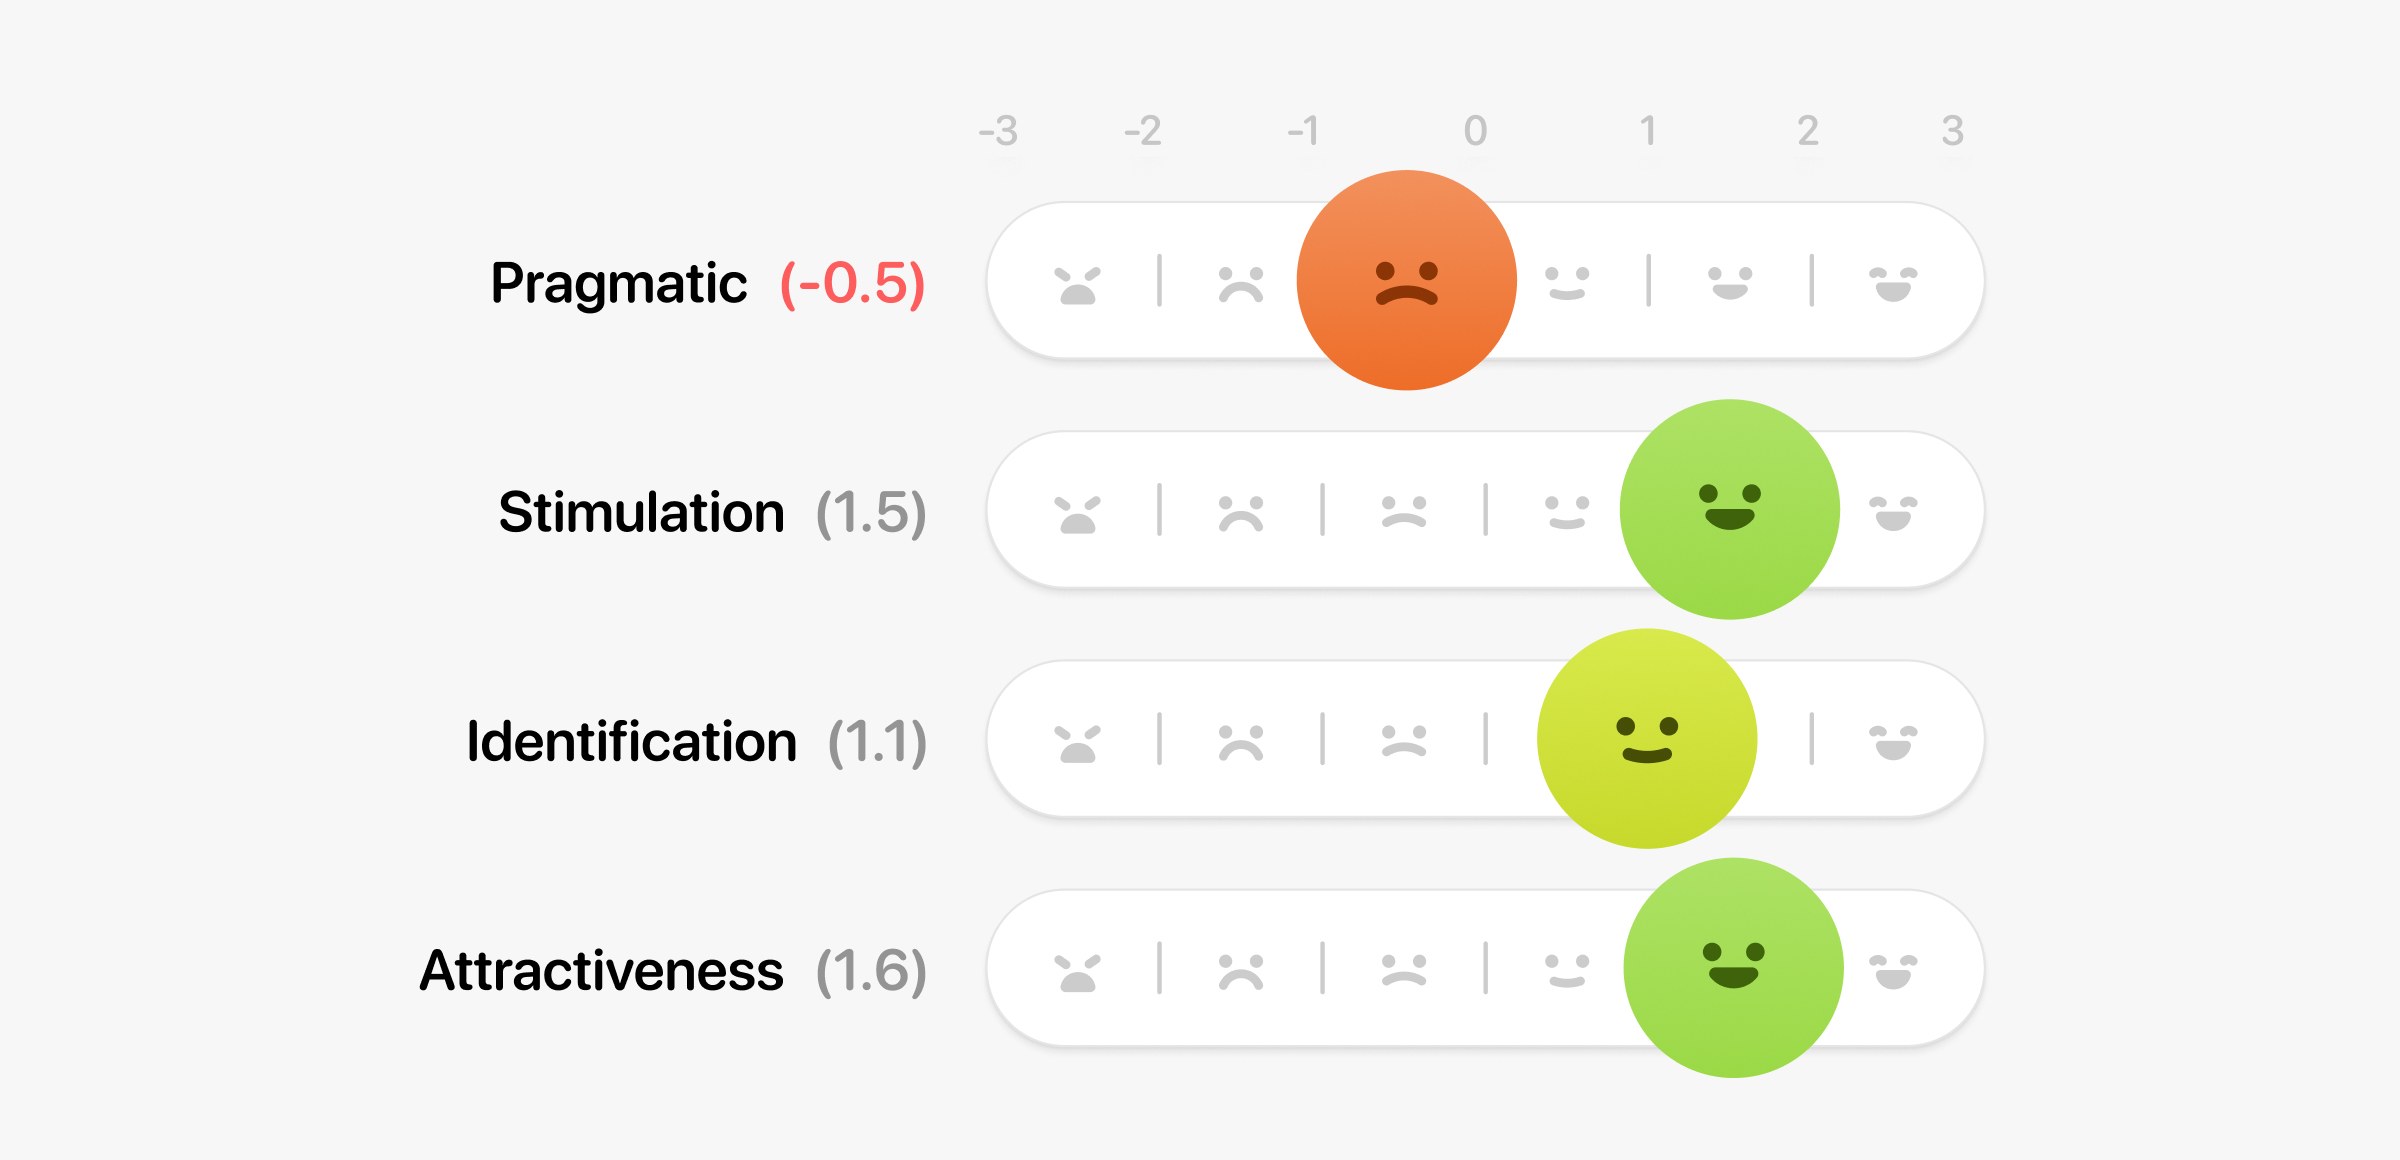
Our testing showed that people liked the concept (+1.5 Stimulation), but it also pointed out a major usability flaw (-0.5 Pragmatic Quality). We had originally used heatmaps to show emotion, and they were simply too dense and confusing to read during a longer monitoring session.
Empirical Iteration
To fix this, I made a few key changes to filter visual noise and gain affordance:
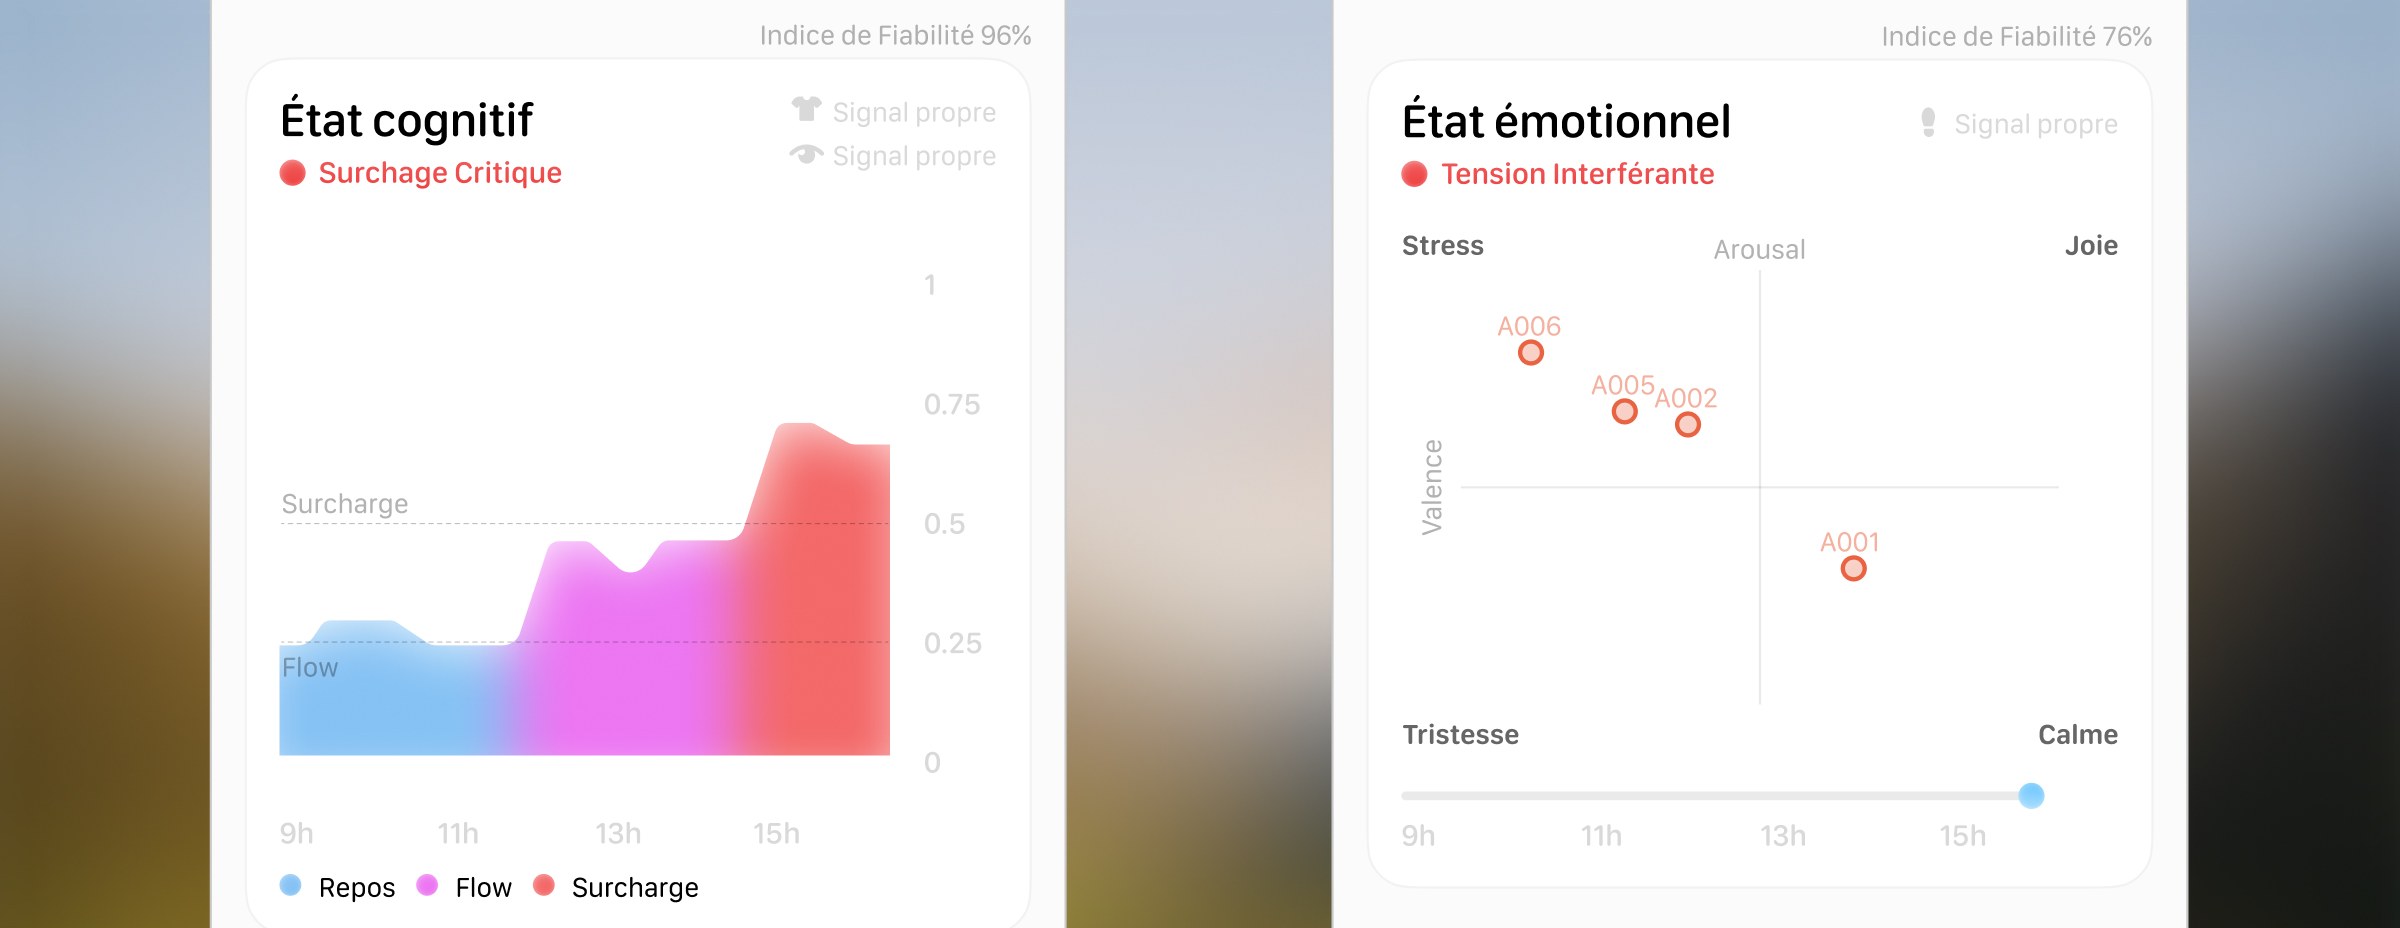
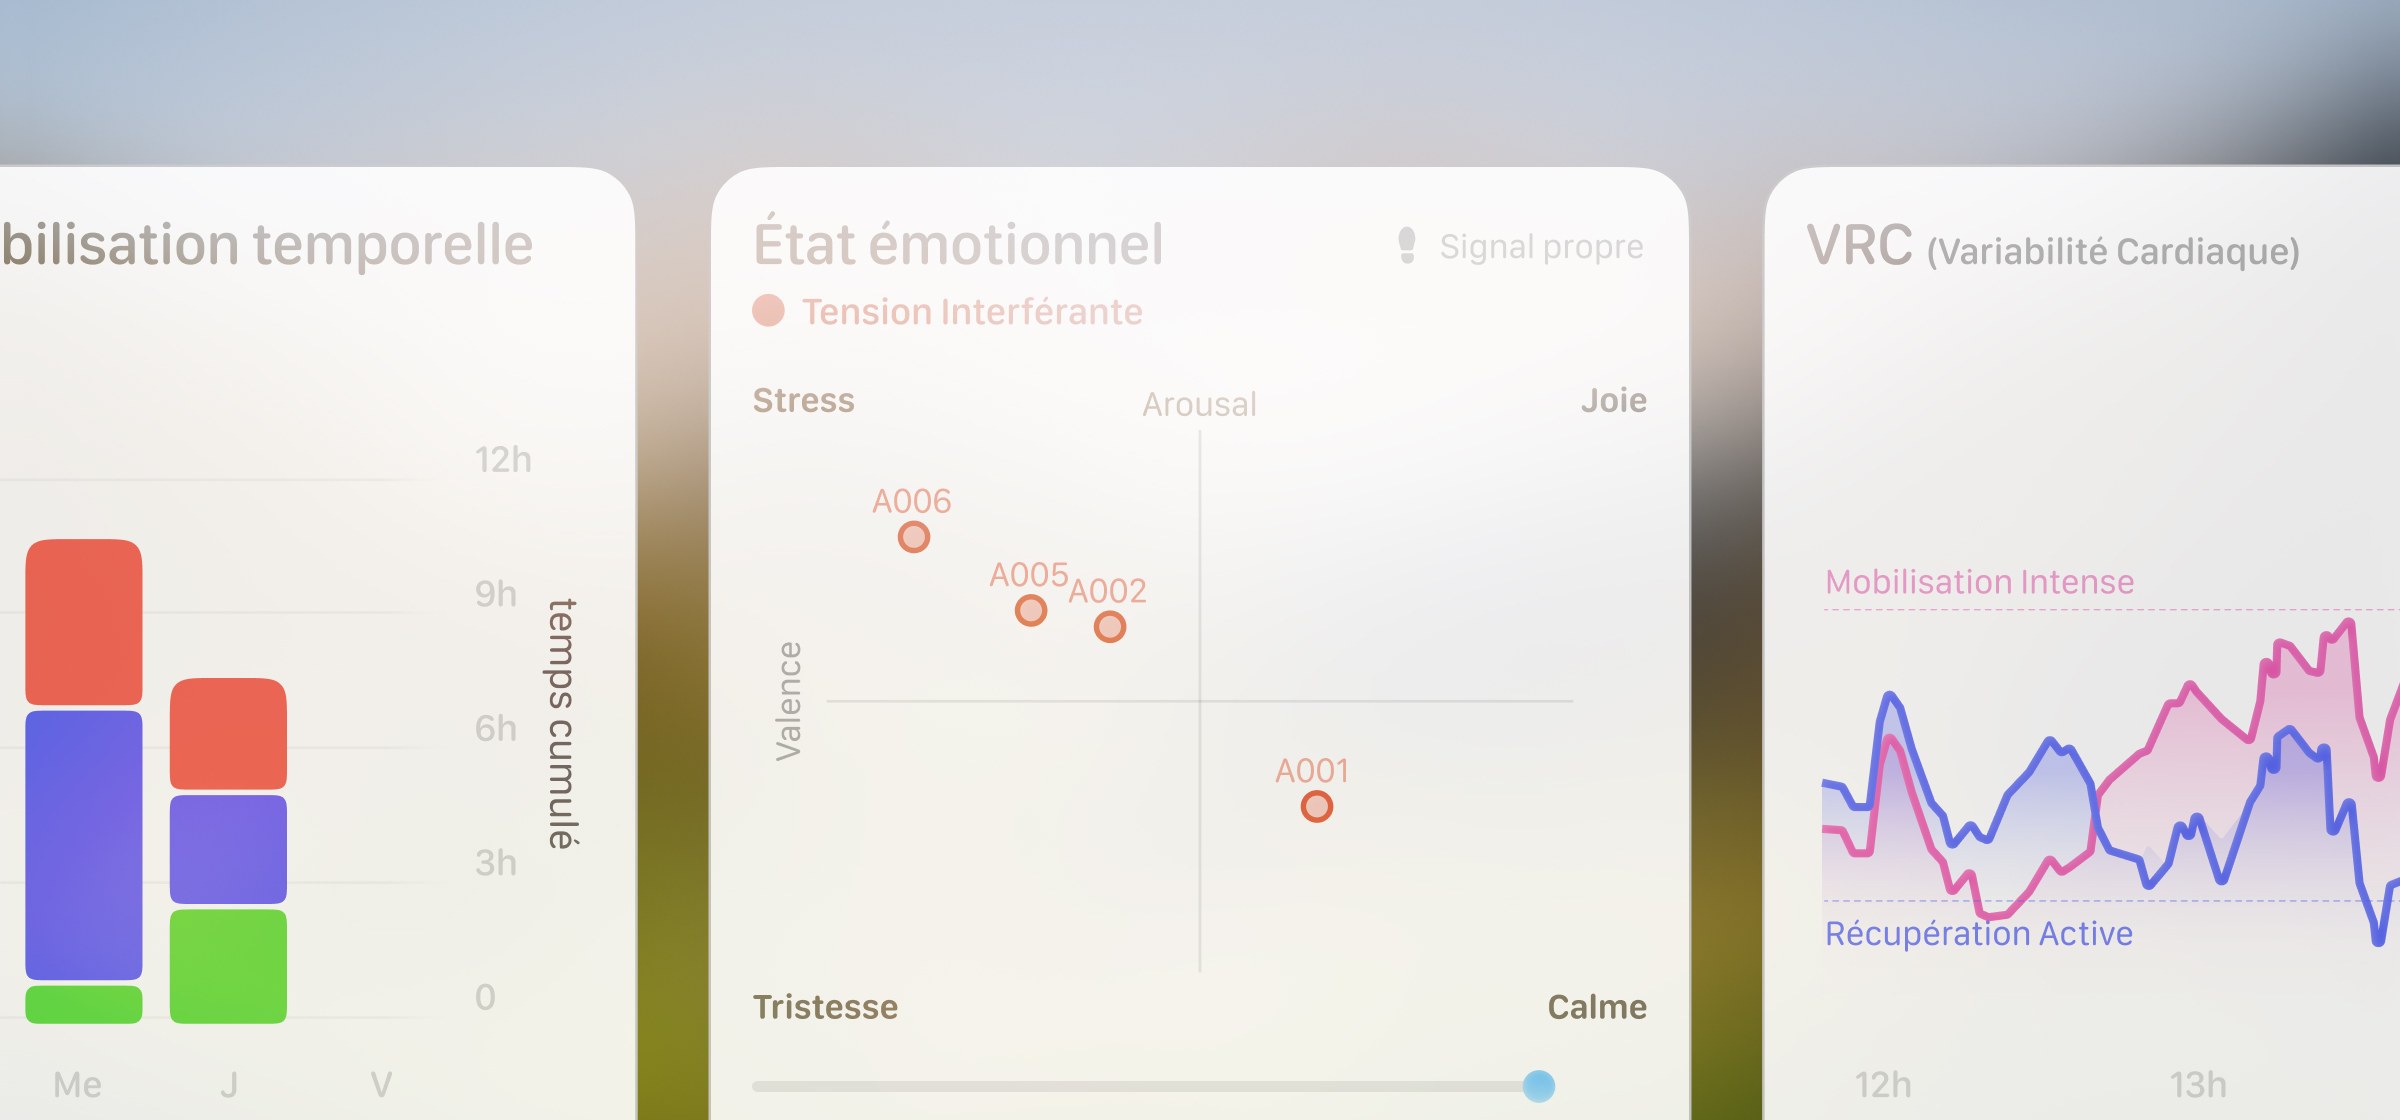
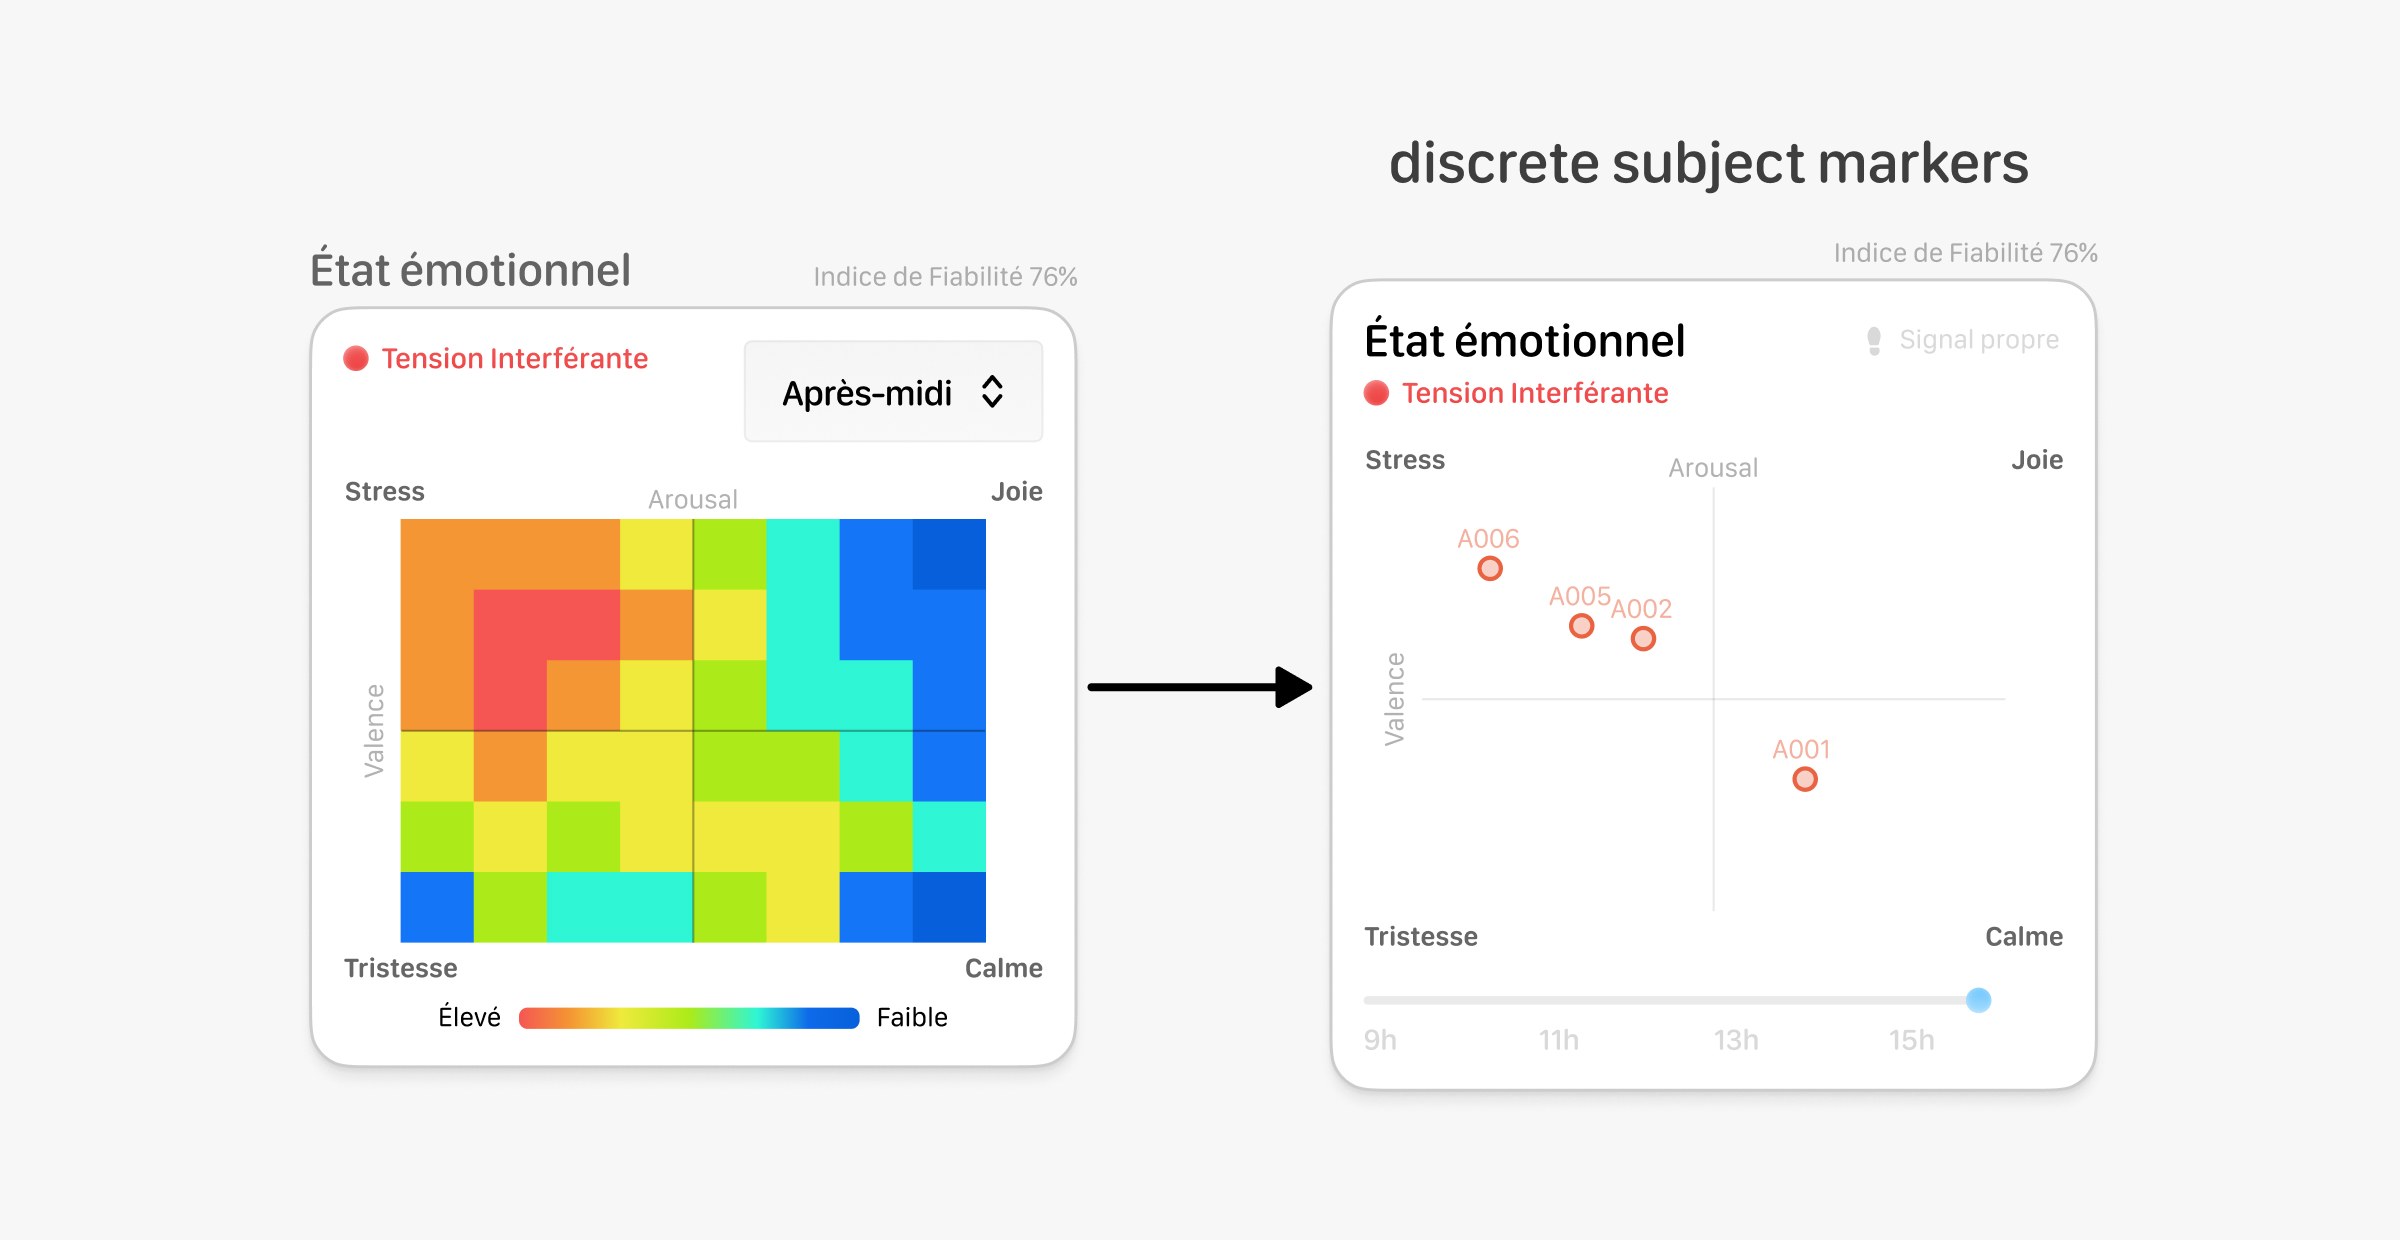
- I dropped the complex heatmaps in favor of a simple 2-dimensional grid based on Russell’s model. By plotting discrete subject markers, the eye is instantly guided to critical outliers rather than scanning a chaotic 3D map.
- I paired this grid with a temporal slider, letting users track short emotional peaks and separate them from long-term fatigue.
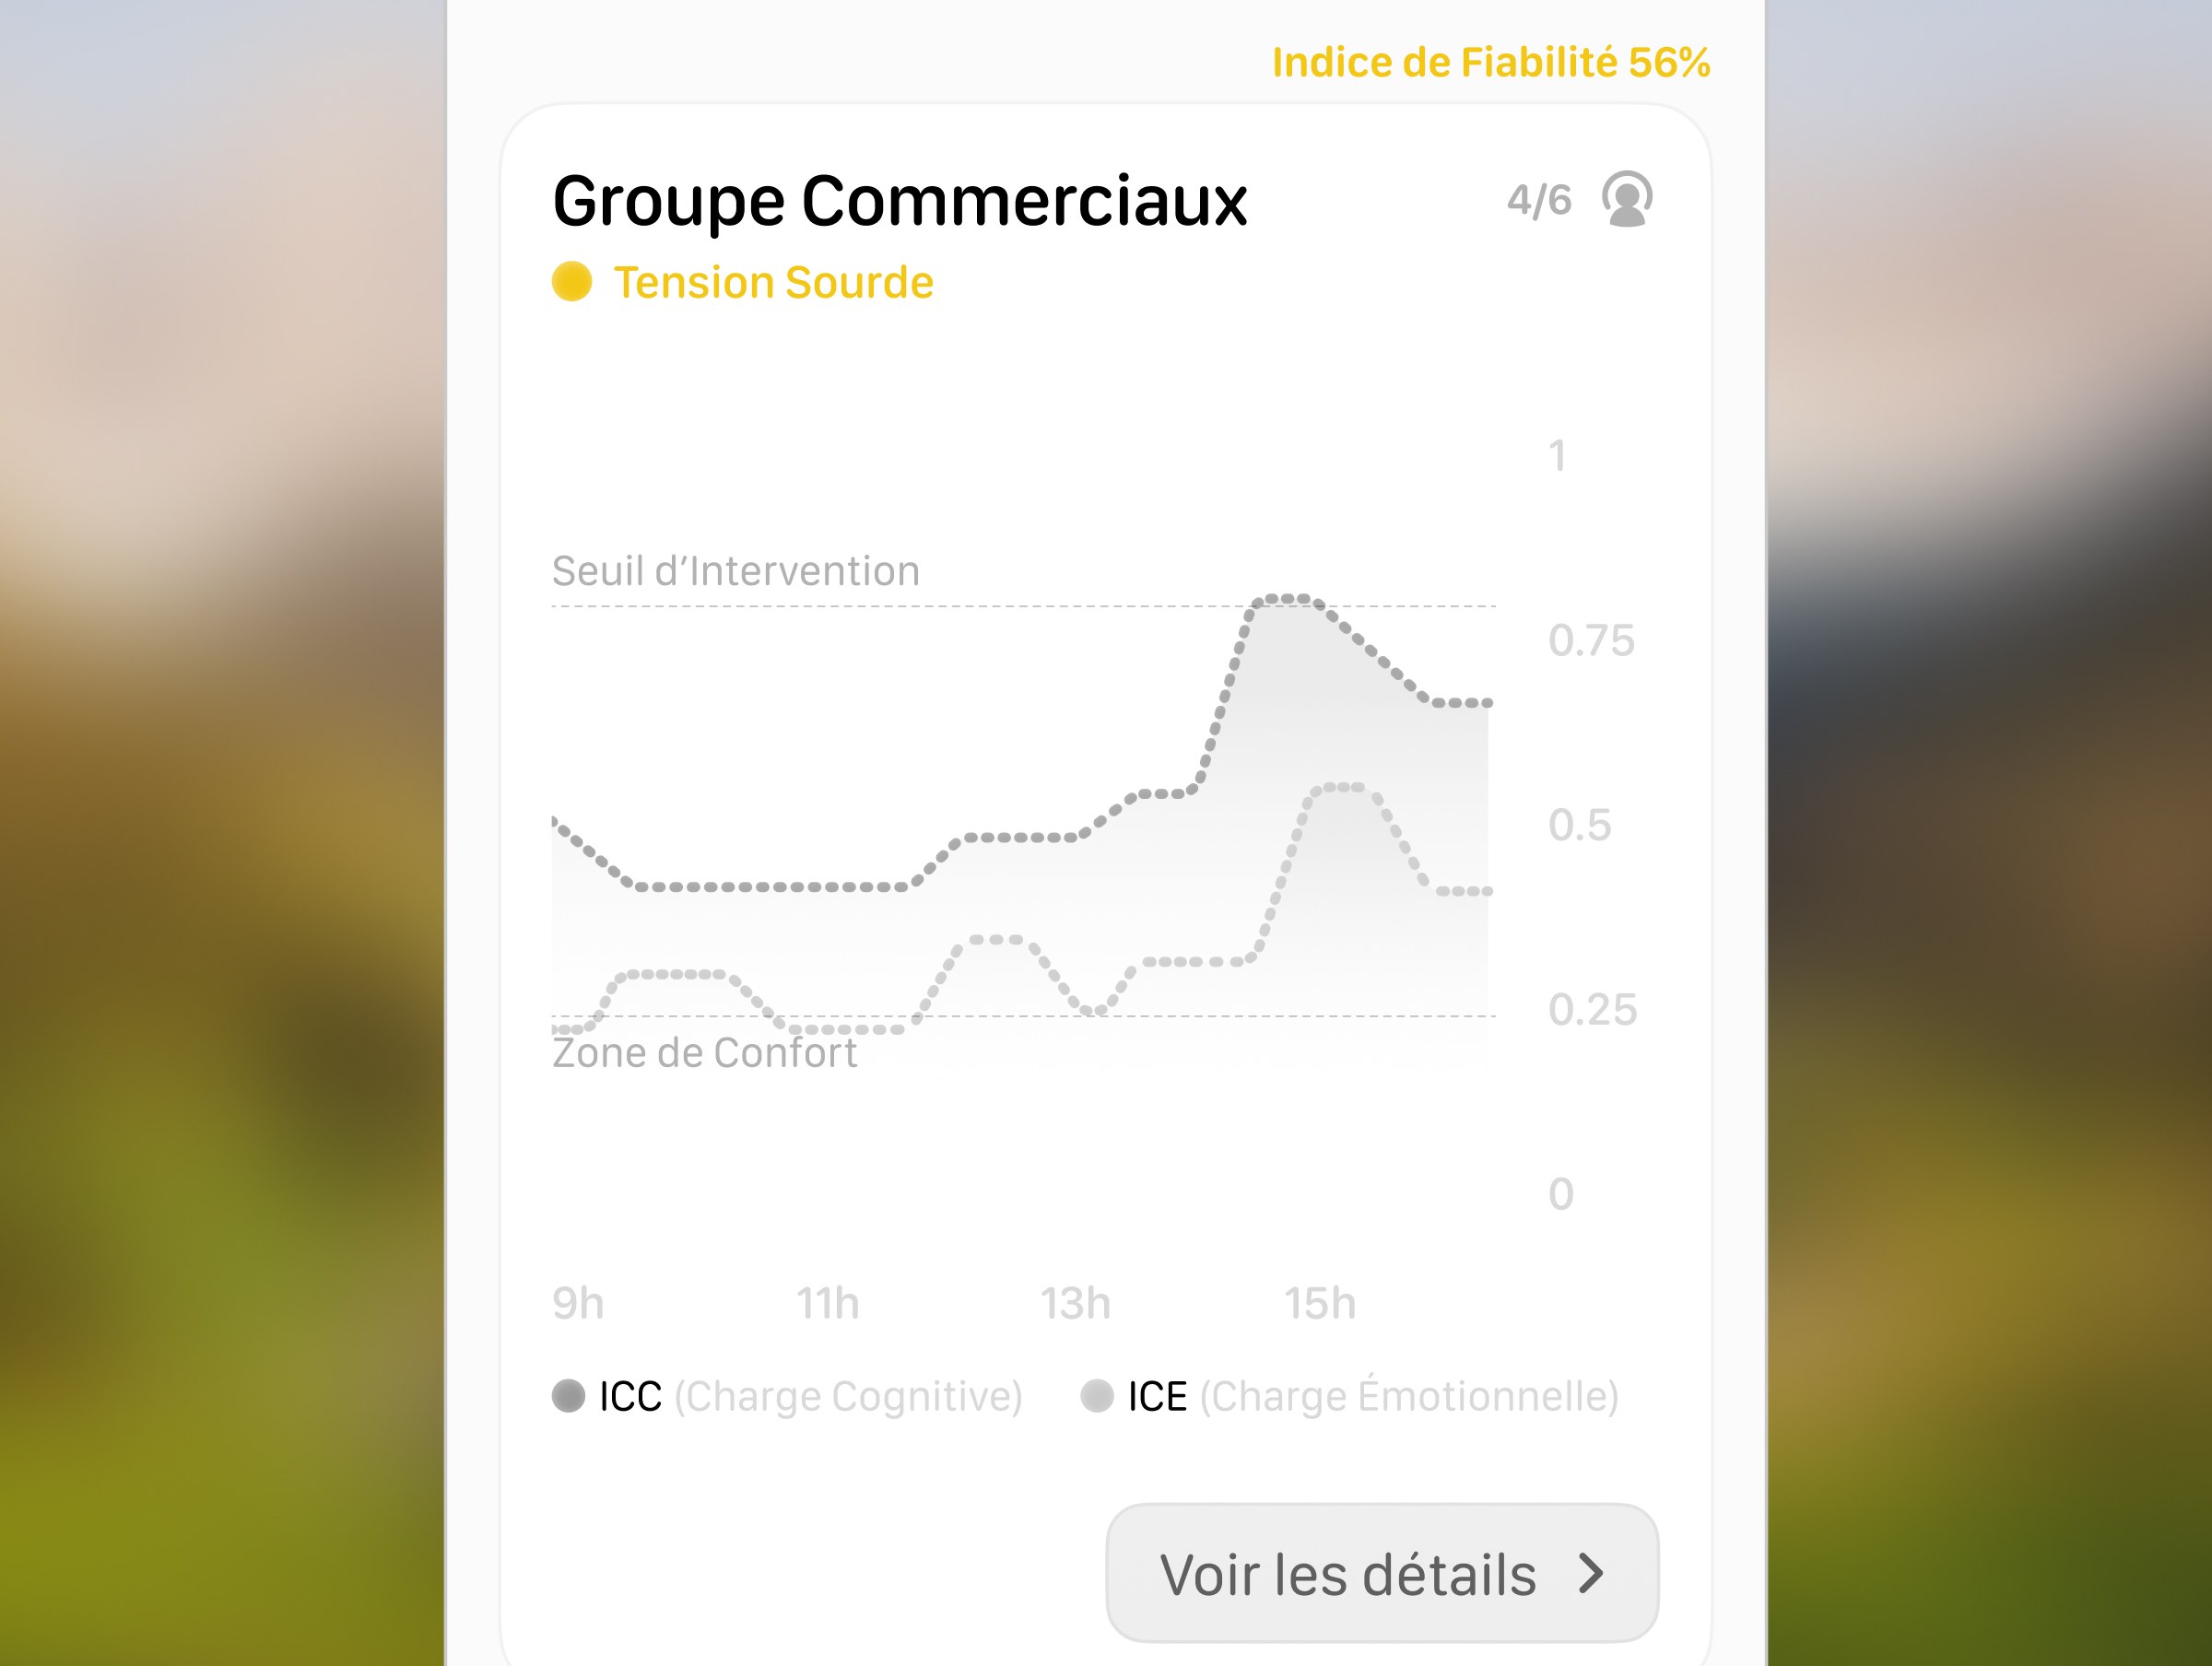
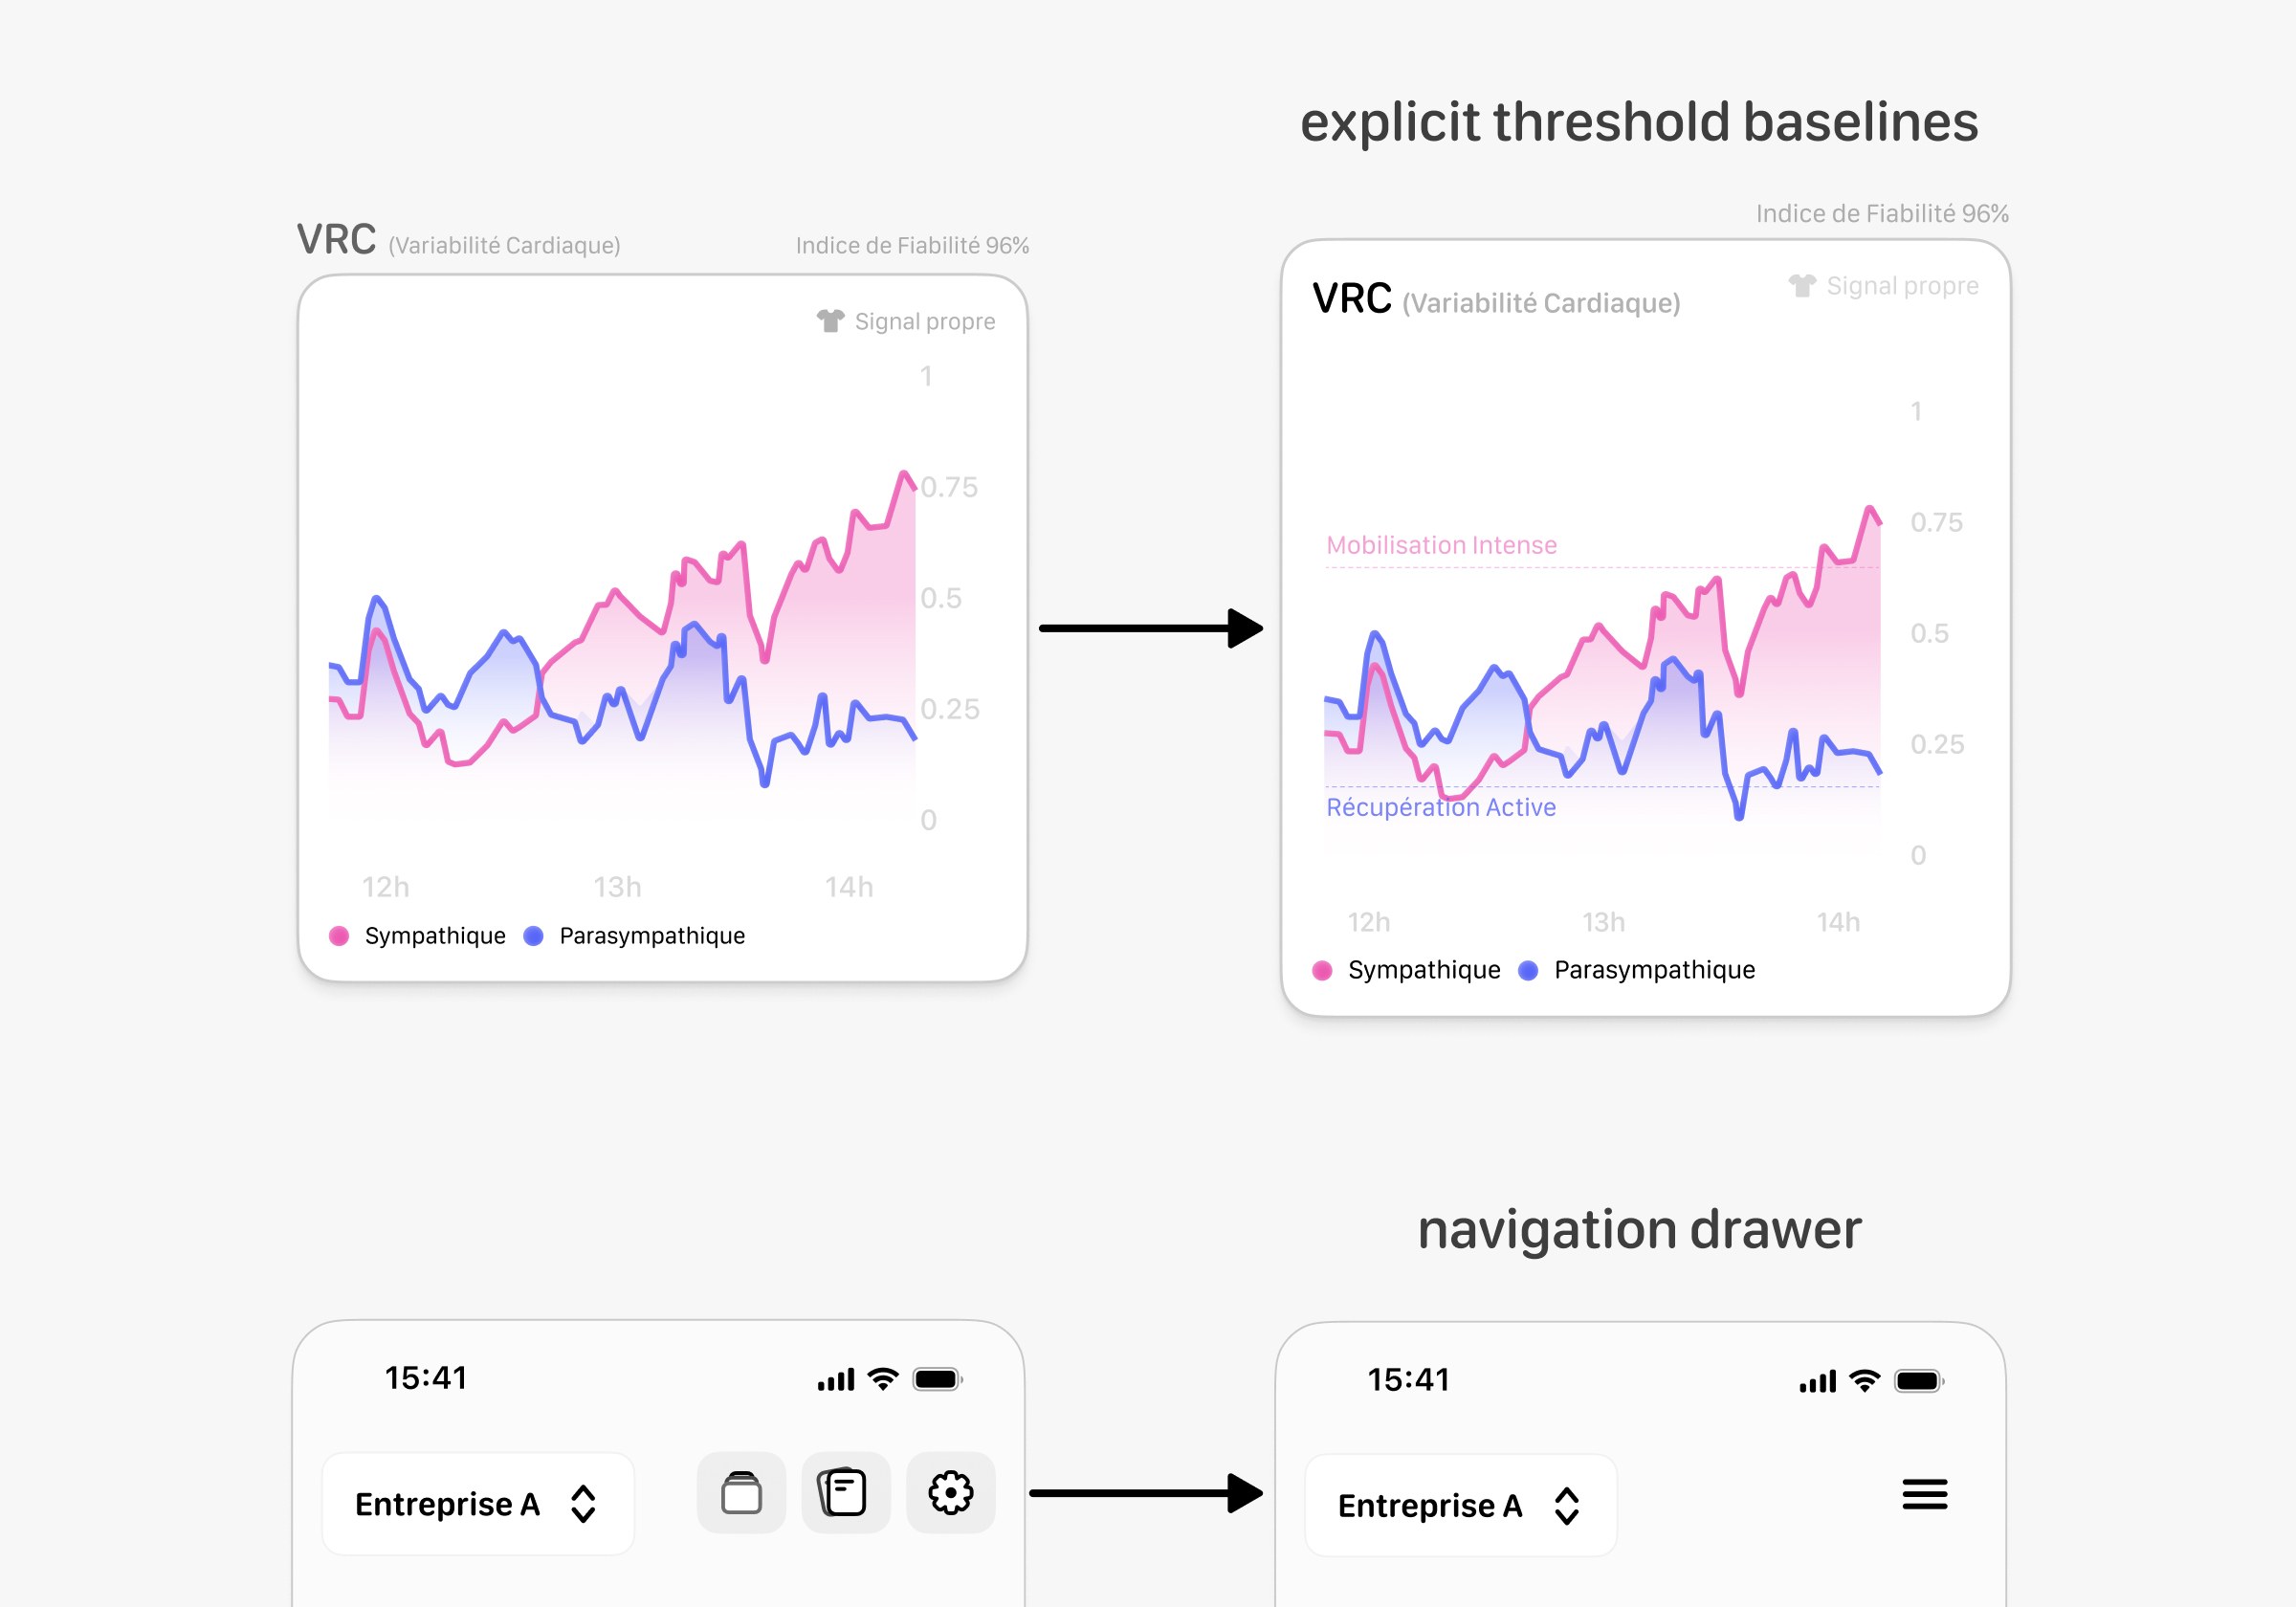
- I added explicit threshold baselines across all the charts to remove interpretive guesswork, and moved extra actions into a simple menu to keep the main screen focused on the data.
Takeaways
Building this prototype in a week meant we had to focus only on the most important features. Testing taught us a hard lesson about overcomplicating data visualization: simple is almost always better.
If we were to take this further, the next step would be testing the updated design in the field with actual corporate ergonomists to see how it holds up in a real workplace.